Business Sustainability
Why organisations use the Da Vinci/Colegrin Business Longevity Indicator (BLI):
The BLI measures the potential areas of vulnerability within a company that may affect
its future sustainability. The more vulnerable the company is in today's terms, the less
sustainable its future.
Boards and top management use it to improve their sustainability score and to close weaknesses
gaps.
BLI results are used for benchmarking purposes, ensuring current market competitiveness.
Large organisations use it to assess companies in their supply chain so as to strengthen and
stabilise them.
Investors and business analysts use it to make informed investment decisions.
A company can choose to verify its sustainability results by an independent body and report on the
outcome.
BLI identifies vulnerabilities within a company that may exclude them from local or
international investment opportunities."The bend in the road is not the end of the road unless you fail to make the turn"
What is the Da Vinci/Colegrin Business Longevity Indicator (BLI) ?
|
Whatever made you successful in the past, won't in the future
-Lew Platt, Chairman and CEO, Hewlett Packard
|
BLI is the creation of present value and future worth.
|
The Dimensions covered in the Business Longevity Indicator:
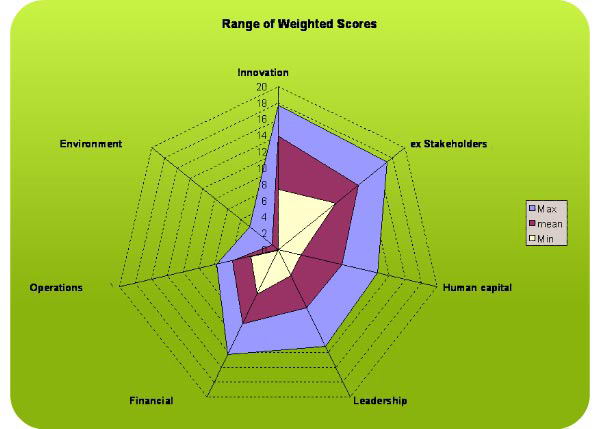
The BLI consists of one-third soft and two-thirds hard data, which maintains a good research balance of secondary (internally collected) and primary (externally collected) data. The BLI is a number score that typifies the overall readiness of an organisation to enter the business arena of a distant future. The BLI is represented as a radar chart with the following seven dimensions:
Growth and Innovation: Evaluates current attitudes toward growth and innovation, including culture,
practices and capabilities with which to improve current products and services, creating new markets
and developing an environment conducive to sustainable growth.
Human Capital and Relationship Attitudes: Determines the extent with which sustainability is supported
by the corporate approach to its people.
Leadership and Corporate Governance: Gauges the impact of corporate governance on overall
corporate sustainability and determines the ability of top management to lead the business through
high growth stakes into a vastly different future.
Financial Stability and Flexibility: Evaluates the financial contribution to sustainability and the
flexibility of the organisation to remain relevant in future.
Operational Excellence: Establishes the levels of operational excellence and execution competence
as a contribution to sustainability. Evaluates the ability of systems and processes to adapt to
future scenarios and determines the ability to translate new technology into competitive advantage.
Internal and External Stakeholders: Identifies the organisation's culture, systems and processes
and how they are geared towards delivering customer value today and in the future.
Environmental Attitudes: Determines how the company cares for the environment and the
communities in which it operates now and in the future.
Sample of a Business Longevity Index:

Figure 1.
|